.png?height=120&name=grit42_Yellow(logo).png)
Experiment data
- Find the relevant experiment
- Click the relevant experiment row. The experiment will now open and display the data
- As a default the experiment data are shown in the “100%” view. This means that the individual data tables - Raw, Groups, Results - are shown in full width under each other => the user will have to scroll down to see the Results view as can be seen in the picture below
NOTE: Empty tables are closed by default.

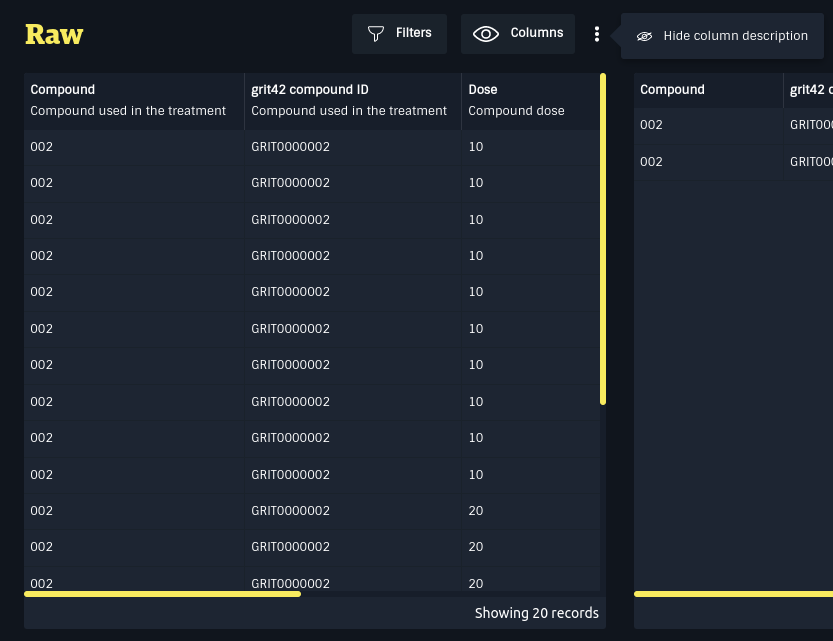
- The user can decide to switch to the “Column” view in order to get the tables - Raw, Groups, Results - shown next to each other. This can make sense when viewing in vivo animal level data.
NOTE: In this view the space does not allow many columns per table. It can therefore make sense here to adjust what columns are shown.

- The user can toggle showing the column description by clicking on the
icon and clicking “Hide/Show column description”
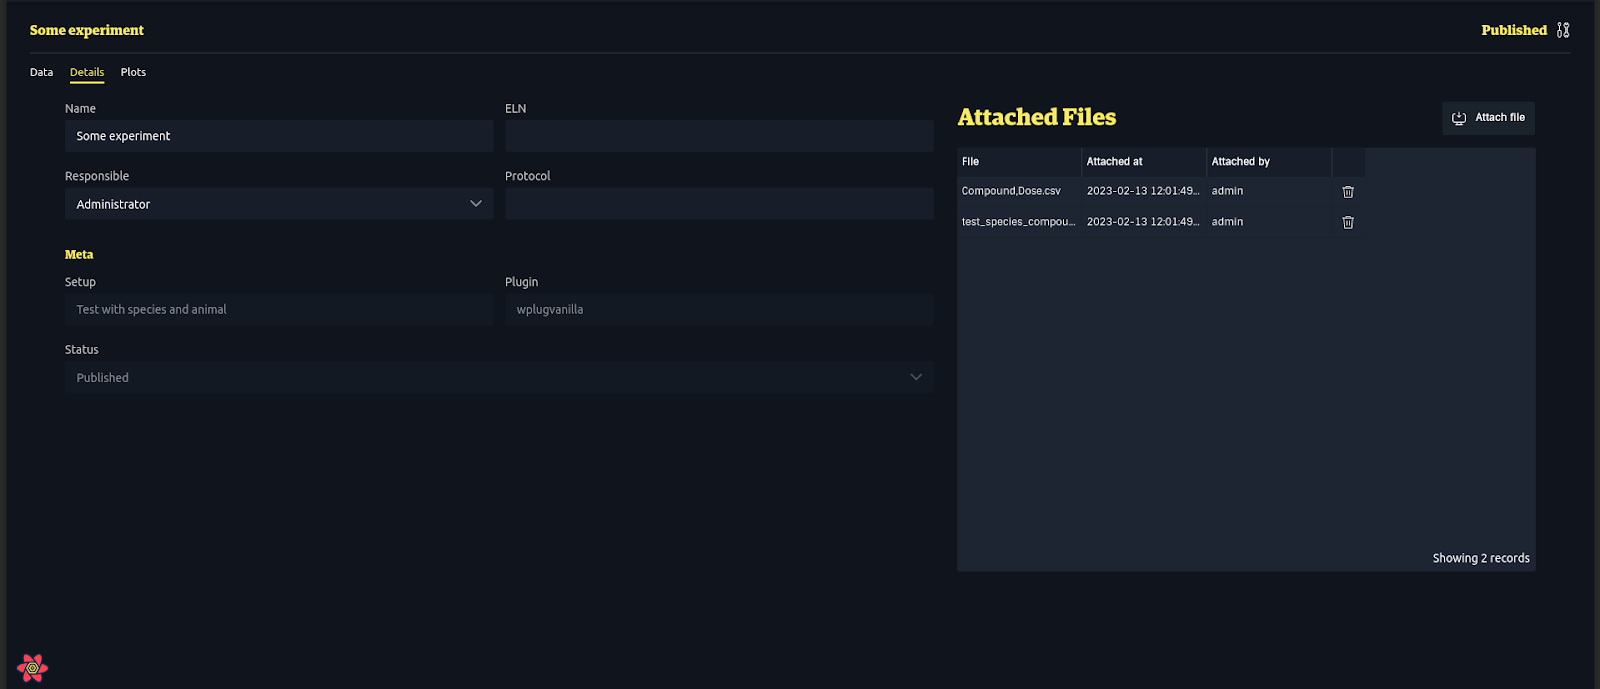
Experiment details
Under the Details tab, the user can see information about the Experiment and change some of them given the proper permissions:
- The experiment name
- The experiment ELN and protocol reference
- The Setup and its type
- The experiment status
- The files attached to the experiment