.png?height=120&name=grit42_Yellow(logo).png)
Plate based curve fit experiment
Plate based curve fit experiments consist of one or more plates that will provide the basis for curve calculations. For the system to calculate the curves of a plate, used wells need to have defined:
- a usage (control, reference or subject), which will be used for grouping
- a concentration
- a normalised value, which can be calculated from cell counts or imported
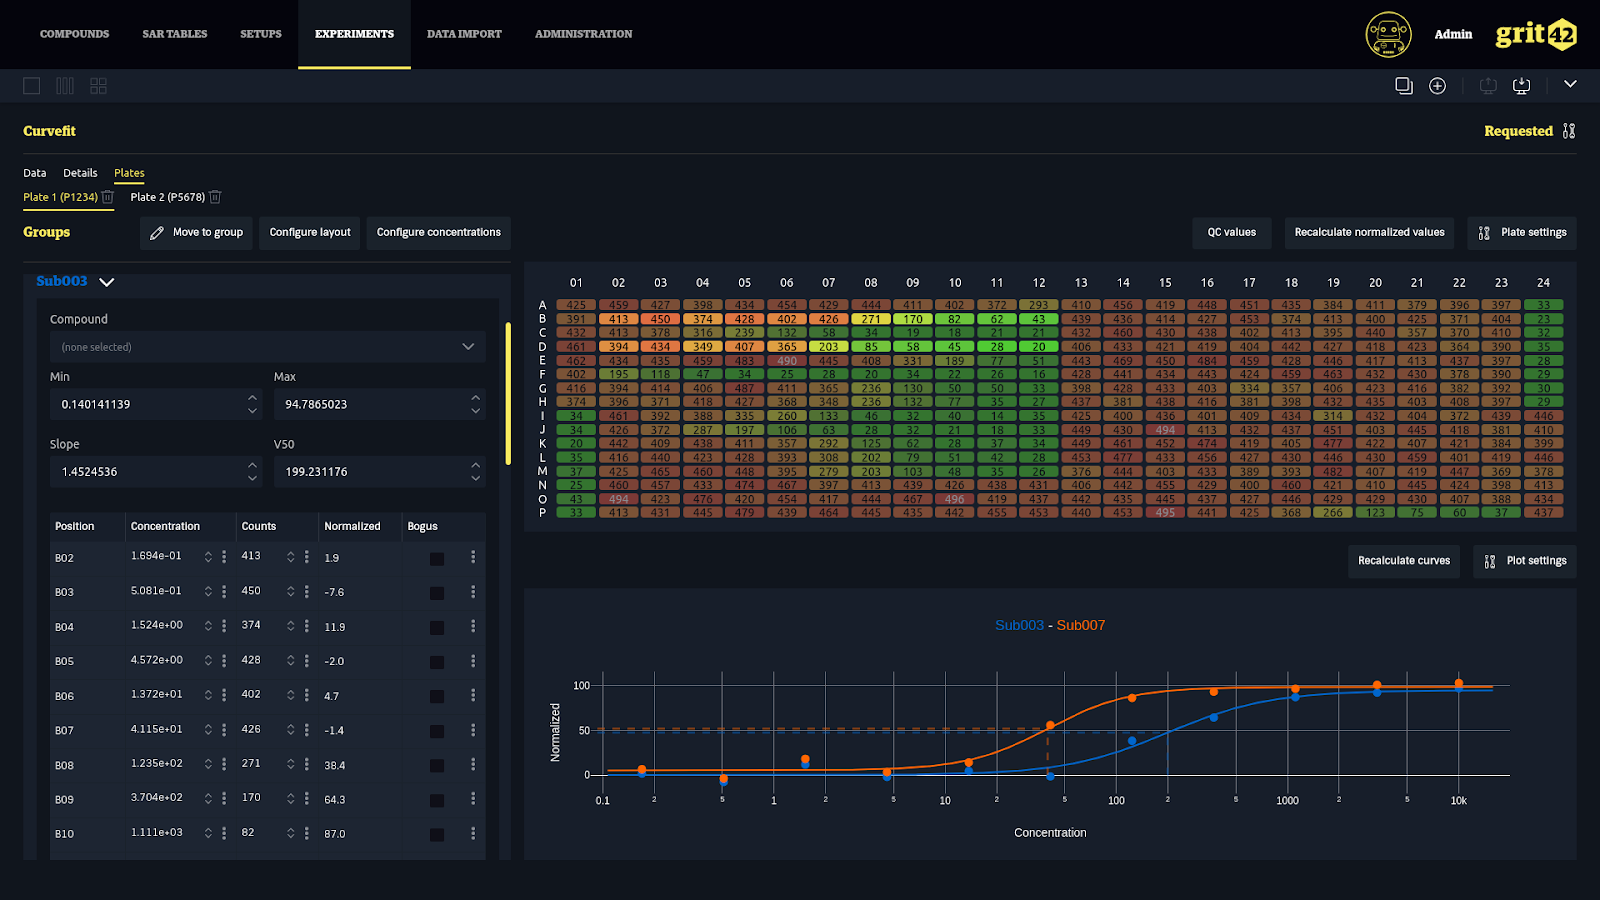
Interface of a curve fit experiment

On the left side, a list of the subjects in the plate. Subjects can be expanded to show the compound they are linked to, calculated curve values if available, and a table showing the wells with this subject. Individual wells can be edited by changing the values in this table.
On the top right section, a visual representation of the plate.
Plate view settings can be changed using the “Plate settings” button in the top right
Users can change the visualisation to show subjects, counts, normalised values or concentration in the plate wells.
Users can also change the coloration of the wells to show the colour of subjects, or a heatmap based on counts, normalised values or concentration.

Wells can be selected by clicking, or holding click and dragging. To add or remove from the current selection, hold the Ctrl key while interacting with the plate view.
On the bottom right, the curve of the selected subjects. Curves can be compared by selecting two or more subjects.